Here is a number that should make every brand head slightly uncomfortable.
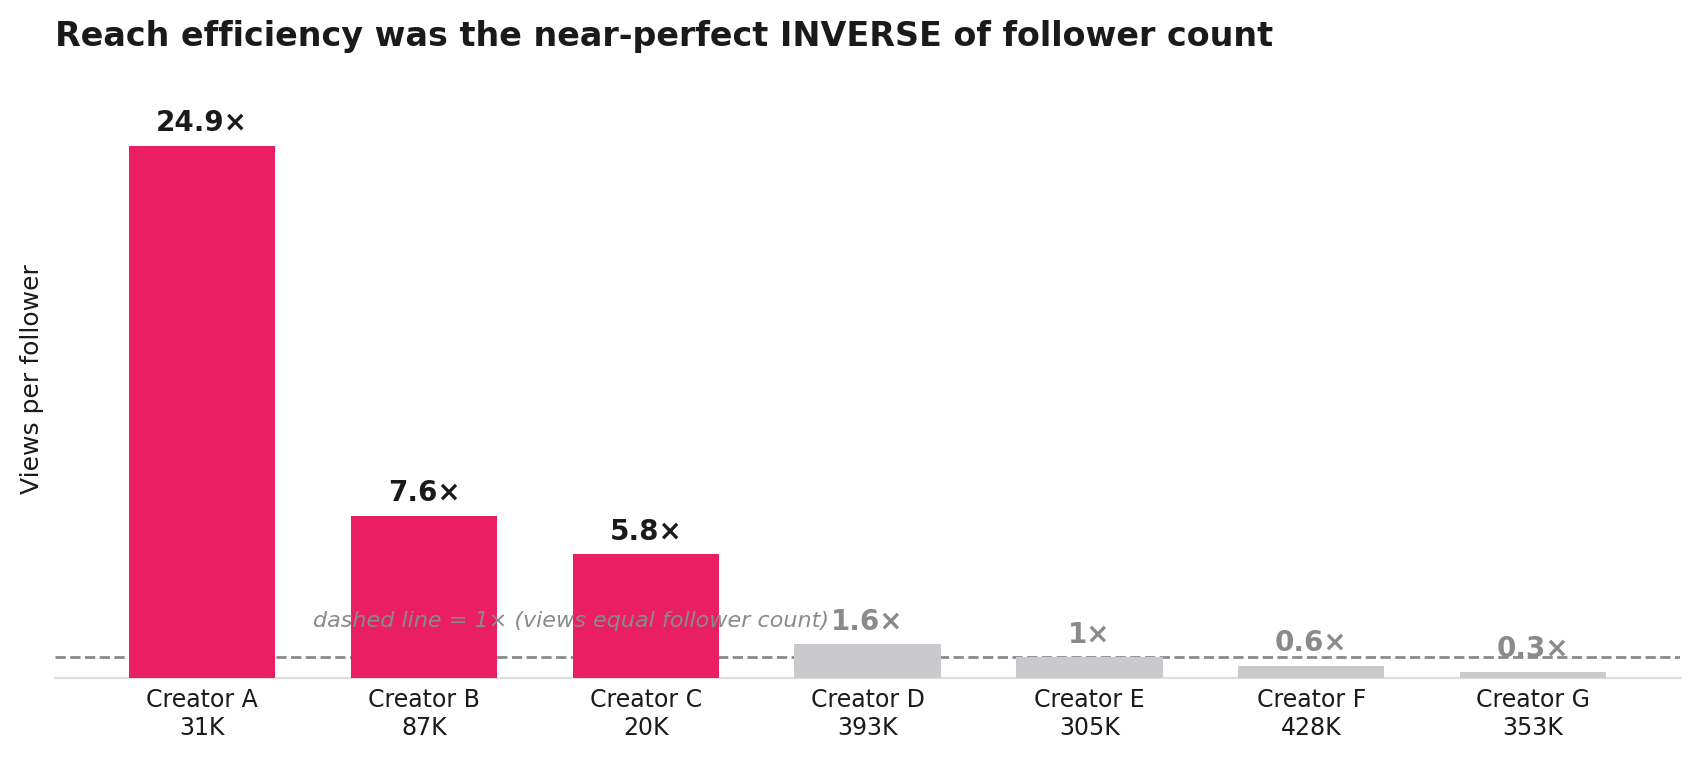
In a recent campaign we ran for a legacy Indian cookware brand — nine creators, two months, 2.8 million views — the creator with 31,000 followers generated 773,000 views. The creator with 428,000 followers generated 241,000.
Read that again. One-fourteenth the audience. Three times the reach.
On a per-follower basis, the small creator was 44× more efficient than the large one. And this wasn't a fluke at the edges of the data. When we lined up all nine creators by reach efficiency — views divided by followers — the ranking came out as an almost perfect inverse of follower count.
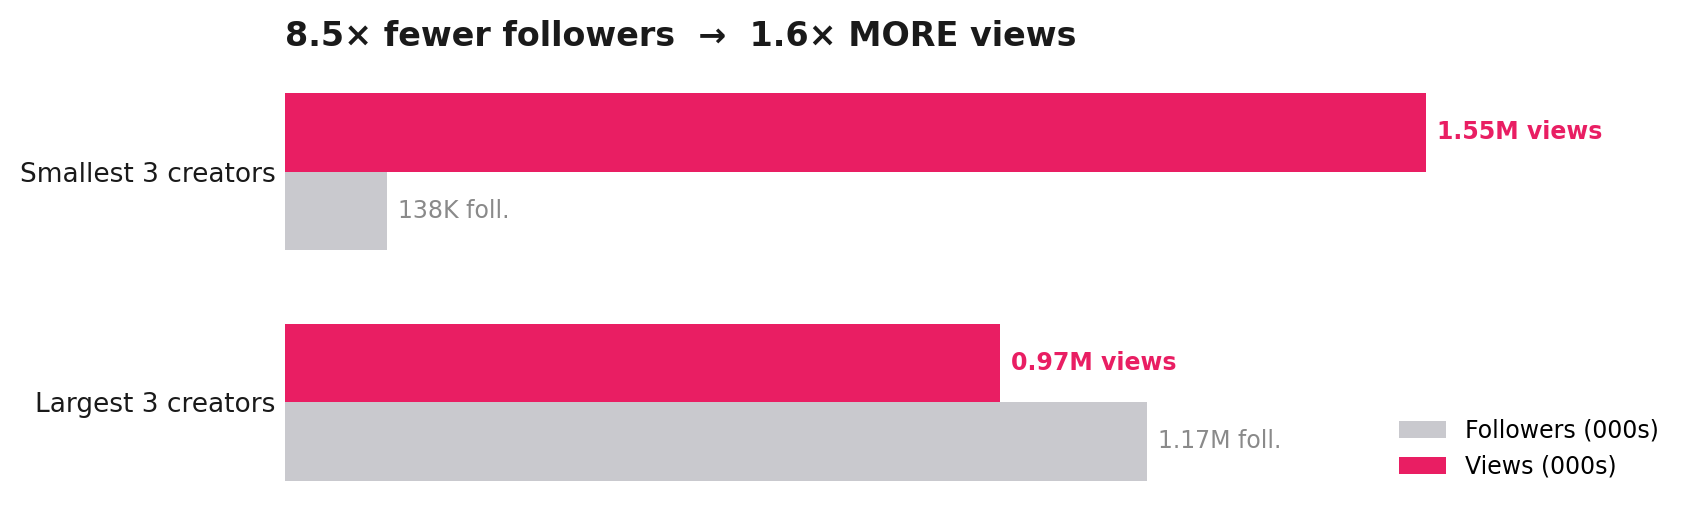
The three smallest creators (138,000 followers between them) pulled 1.55 million views. The three largest — 8.5× more audience — pulled 974,000.
If you've ever built an influencer budget by sorting a sheet from highest follower count to lowest and paying accordingly, this is the post that ruins that sheet for you. Good.
The uncomfortable truth: you're not buying an audience. You're renting an algorithm.
Across the whole campaign, ~85% of views came from people who don't follow the creator. On the top-performing reels, it was closer to 89%.
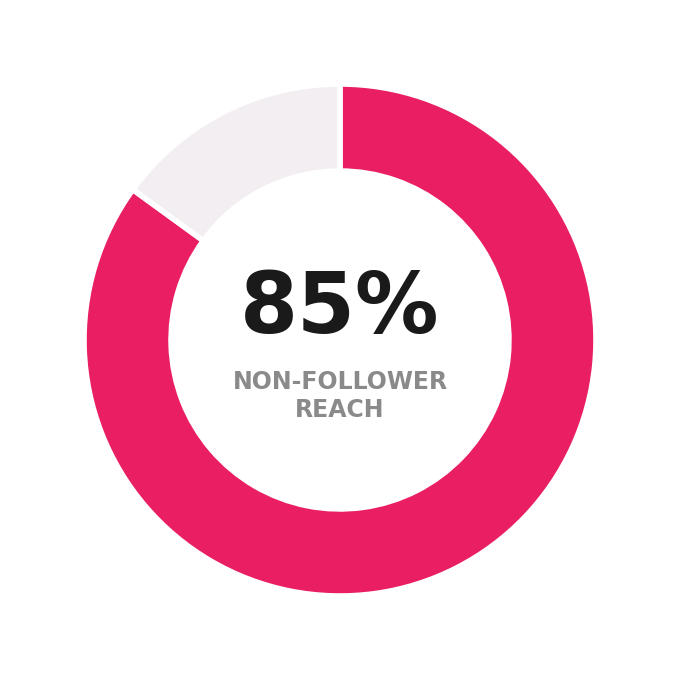
Sit with what that means. The follower count you paid a premium for delivered roughly one in ten of the views. The other nine came from Instagram's recommendation engine deciding, reel by reel, whether to push the content into the feeds of strangers.
So the mental model most brands run — "I'm hiring this creator to put my product in front of their audience" — describes 11% of what actually happened. You weren't borrowing an audience. You were buying a lottery ticket into the algorithm, and the creator's content was the ticket.
This single reframe changes every downstream decision:
- If reach comes from non-followers, then follower count is a proxy you're mistaking for the product. It tells you who already liked this creator — not whether the algorithm will carry the next reel to strangers.
- If the algorithm is the distributor, then the content is the media buy — not the creator. You're not casting a face; you're commissioning a piece of distribution.
- And if that's true, the lever isn't "how big is their audience," it's how good is this reel at earning the next impression.
Retention is the real currency. We watched it triple a creator's reach overnight.
One of our creators posted two reels for the brand. Same person, same followers, same product. Reel one drew 77,600 views. Reel two drew 210,700 — nearly 3× the reach, from the identical account.
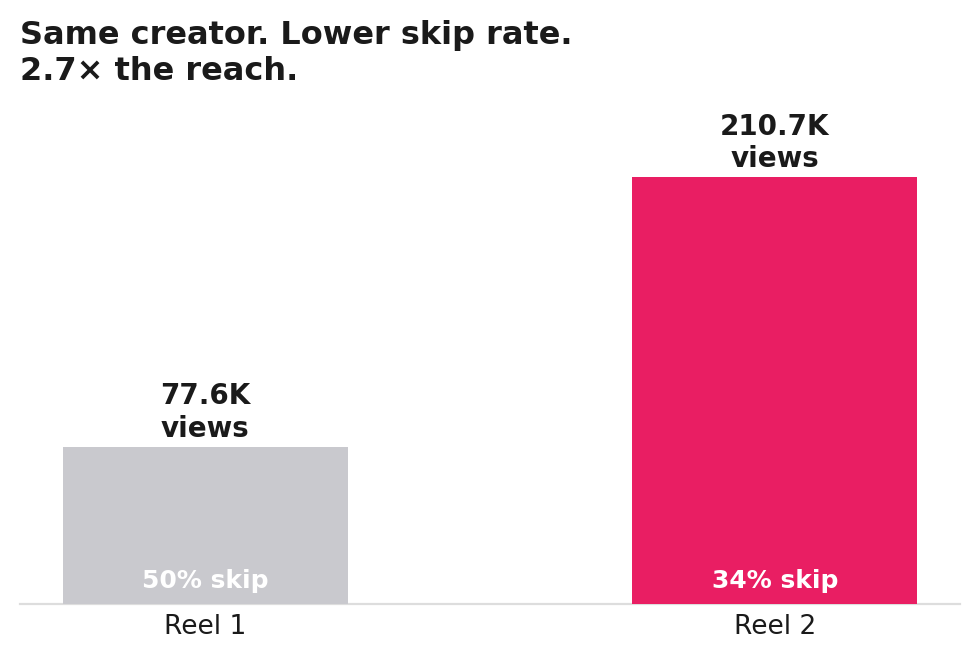
What changed? Almost entirely one number: skip rate. Reel one lost 50% of viewers early; reel two lost 34%. Better hook, tighter first three seconds, stronger watch-through — and the algorithm handed it to three times as many strangers. Nothing about the creator changed. Everything about the content did.
Brief for the first three seconds and the watch-through, not for the reach. Reach is the output; retention is the input you can control.
Content doesn't just reach an audience. It selects one.
The campaign overall skewed ~90% female — exactly right for household kitchenware, where women are still the dominant purchase decision-makers. Except two of the reels — a regional, dialect-led food format — came back ~55% male.
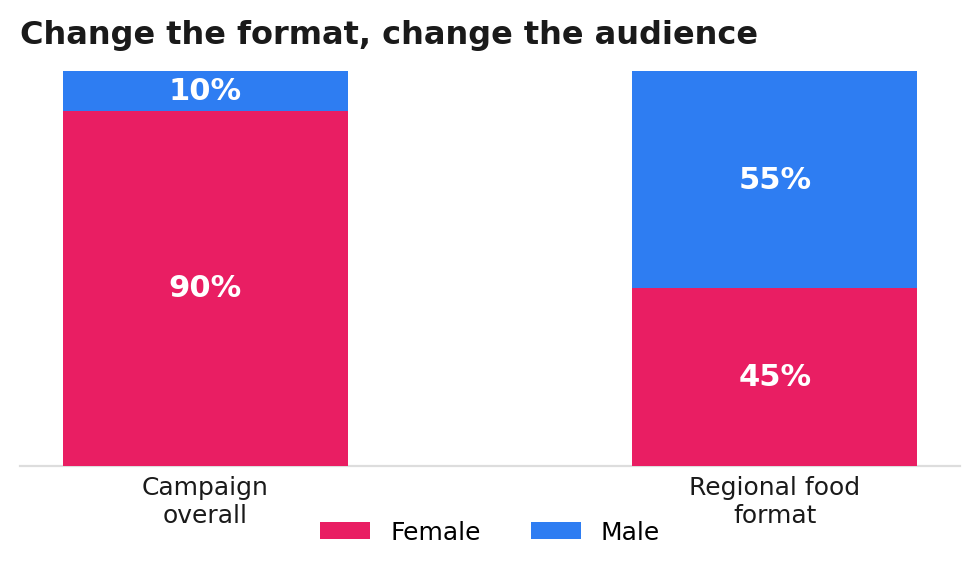
You are not casting a person and inheriting their audience. You are choosing a content format, and the format summons an audience out of the algorithm. Change the format — regional vs. aspirational, tutorial vs. comedy, POV vs. review — and you change the demographic that shows up, often more than changing the creator would. If you're not briefing content against the audience you want delivered, you're letting the algorithm pick your target market for you.
Likes are applause. Saves are intent. Know which one you're selling.
For a cookware brand, the most valuable action a viewer can take isn't a like. It's a save — the digital equivalent of "I'm going to cook this," the closest free proxy to purchase intent that exists. Our best reels drove 300–500 saves each — the number we'd put on the first slide, because in a considered-purchase category, saves predict revenue and likes predict nothing.
And the metrics reshuffle the leaderboard depending on which you believe in: our highest-reach creator wasn't our highest-engagement creator. Our 20,000-follower creator posted the highest like-rate in the whole campaign (4.4%) while sitting near the bottom on raw views — a small, dense, high-trust audience a follower-sorted spreadsheet would have cut first.
Three metrics, three different "best" creators. The brand that measures only views is running the campaign with two eyes closed.
The question a marketer asks that an influencer agency doesn't.
Here's where we turn the knife on ourselves, because good marketing means being honest about the number that flatters you. The campaign's biggest reach landed on an 18–24 audience (54% of viewers) — beautiful for virality. But the person who actually buys a ₹3,000 pressure cooker to set up a household often sits in the 25–34 band.
So the honest question isn't "did we go viral?" — we did. It's "did the virality land on the buyer, or just on a big number?" That question separates a distribution vendor from a marketing partner. Anyone can sell you reach; the harder job is reading the audience the content actually delivered, comparing it to the audience that actually buys, and steering the next wave toward the overlap.
So here's the new scoreboard.
If you run creator campaigns and want them to build the business rather than the deck, retire the follower-count sort and grade on four things instead:
- Reach efficiency (views ÷ followers) — are you buying distribution, or overpaying for an audience that barely shows up?
- Retention / skip rate — the actual lever that earns non-follower reach. Brief for it.
- Intent signal (saves for considered purchases; DMs / link-clicks for direct response) — the free proxy for revenue.
- TG match — did the reach land on the buyer, or on a bigger, younger, cheaper number that feels good and sells nothing?
Follower count isn't on that list. In this campaign, it didn't just fail to predict performance — it predicted the opposite of it.
We don't sell reach. We engineer distribution to the people who actually buy.
Most influencer agencies sell you access to audiences and report back the views. We think that's the easy half of the job — and increasingly the wrong half. The valuable half is understanding your target group, engineering content the algorithm will route to that group, and measuring the signal that predicts a sale rather than the one that decorates a slide.
We can show you, reel by reel, exactly who the content reached and whether they were the right ones. If your last campaign report led with total views, ask for the other four numbers. If nobody can produce them, you've found the problem.